
How Does a Grading Bell Curve Calculator Work?
Understanding The Basics Of Bell Curve Grading
From experience, a bell curve reframes grades through normal distribution, allowing students to see placement beyond raw results. Instead of fixed expectations, the grading process recognizes variation, aligning evaluation with authentic class performance patterns today.
Rather than rewarding only extremes, educators observe the mean, standard deviation, and evolving score distribution. This perspective shifts focus toward collective growth, where relative performance explains outcomes more clearly than isolated achievements or single examinations.
Why Educators Use Bell Curves To Evaluate Students
Many educators adopt grade curve strategies when test difficulty varies widely across cohorts. By comparing student scores, instructors establish fairness, ensuring strong understanding receives recognition even when exams challenge the entire test population equally.
I have seen teachers rely on grading philosophy rooted in fairness and academic integrity rather than punishment. A curve transforms evaluation into a contextual assessment, emphasizing performance comparison while maintaining alignment with institutional expectations and transparent evaluation standards.
Step-By-Step Process Of Calculating Grades On A Bell Curve
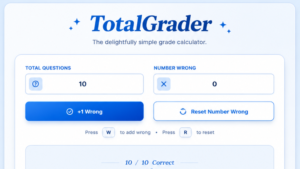
A typical grade curve calculator begins with raw scores, organizing them into a measurable distribution. The system identifies the highest score, calculates the class average, and prepares data for structured score adjustment based on statistical positioning.
Next, algorithms compute each learner’s z-score, translating results into a new distribution aligned with defined grade boundaries. The automated workflow reduces manual errors, producing consistent curved grades while preserving proportional academic relationships among participants.
Key Formulas And Statistical Methods Behind The Calculator
Behind every calculation lies a blend of statistical analysis, normalization, and proven curving methods. Using formulas tied to mean value and standard deviation, the calculator models a predictable bell-shaped pattern reflecting authentic academic variability.
Advanced implementations introduce linear rescaling, proportional scaling, or even square root method adjustments. These mathematical strategies reshape outcomes without distorting learning evidence, allowing educators to interpret results using dependable quantitative frameworks grounded in statistical reasoning.
Fair And Balanced Student Assessment
A well-designed grading curve supports equitable evaluation by accounting for uneven exam difficulty and diverse learning contexts. Instead of penalizing an entire class, instructors analyze relative achievement, creating balanced recognition for both improvement and mastery.
From classroom observation, students respond positively when fair grading replaces rigid thresholds. Transparent score adjustment builds trust, strengthens motivation, and aligns grading outcomes with measurable academic performance rather than unpredictable assessment circumstances alone.

Quick And Accurate Grade Distribution
Modern tools function as an online tool delivering instant results once scores are uploaded. Automated processing organizes grade distribution efficiently, eliminating spreadsheet complexity while enabling teachers to focus on instruction instead of repetitive calculations.
Accuracy improves because algorithms analyze complete datasets simultaneously. With structured reports, educators visualize trends, identify performance distinctions, and generate dependable outputs that simplify decision-making across multiple sections or semesters without sacrificing grading precision.
Avoiding Common Misconceptions In Curve Grading
A frequent misconception assumes curved grades always inflate results. In reality, outcomes depend on class performance, score range, and selected curving methods. Sometimes curves stabilize grades rather than boosting them, reinforcing analytical understanding over emotional reactions.
Experienced instructors review score gaps, examine percentile placement, and confirm alignment with institution policy. Careful interpretation prevents mislabeling curves as unfair, encouraging data-driven reflection instead of assumptions formed without statistical awareness.
How To Apply Bell Curve Grades Ethically
Ethical implementation begins with transparency and respect for institutional standards. Teachers clearly communicate the grading scale, explain the chosen grading curve, and ensure students understand how adjustments relate to collective performance outcomes.
Responsible practice also protects academic integrity by avoiding manipulation. When educators apply consistent departmental rules and document each score adjustment, the curve becomes a professional evaluation tool rather than an arbitrary mechanism influencing final outcomes.
Recommended Online Grading Bell Curve Calculators
Reliable platforms provide visualization through bell curve graph or grade curve graph interfaces. These systems combine analytics with usability, helping teachers analyze student scores, preview outcomes, and export structured datasets for long-term academic recordkeeping.
Many instructors prefer tools offering CSV export and customizable grading categories. Flexible configurations allow adaptation across universities, colleges, or schools, ensuring compatibility with varying institutional grading frameworks and diverse assessment methodologies.
How To Verify Calculator Accuracy For Your Classroom
Verification starts by comparing calculator outputs against manual spreadsheet calculations in Excel. Cross-checking formulas confirms correct standard deviation output, validates mean, and ensures calculated results match expected statistical relationships within the dataset.
Educators should also review visualization outputs and confirm grade breakdown consistency across multiple scenarios. Testing with sample datasets builds confidence, ensuring the chosen calculator produces dependable evaluations aligned with real classroom grading expectations.
Frequently Asked Questions (FAQs)
How Do You Curve Grades?
Curving grades involves adjusting student scores to account for exam difficulty or overall class performance. This process helps ensure that grades more accurately reflect student achievement within the context of the class.
Common grading curve methods include adding fixed points to all scores, scaling grades based on the highest score, or applying a bell curve distribution. The goal is to create a fair and balanced assessment system while maintaining meaningful performance differences among students.
How Do You Find a Normal Distribution?
A normal distribution is a statistical pattern in which most values cluster around the average, forming a symmetrical bell-shaped curve. To identify it, calculate the mean (average) and the standard deviation of the dataset.
When scores are plotted on a graph, values near the mean appear most frequently, while extremely high and low scores occur less often. This distribution is widely used in educational assessment and data analysis.
How Do You Figure Out a Normal Distribution?
To determine whether data follows a normal distribution, start by collecting all scores and calculating the mean and standard deviation. These measurements reveal the center and spread of the data.
You can then calculate z-scores to see how far each value is from the average. If the data forms a balanced bell-shaped pattern when plotted, it is likely following a normal distribution.
What Is a Square Root Curve on a Test?
A square root curve is a grading adjustment technique that increases lower scores proportionally more than higher scores. Instead of adding the same number of points to every student, each score is transformed using the square root function.
This method benefits students with lower grades while still preserving overall ranking order. It is often used when an exam is considered unusually difficult.
How Do You Find the Probability of a Normal Distribution?
The probability of a normal distribution is calculated by determining where a specific value falls relative to the mean and standard deviation. This is done by converting the value into a z-score.
Once the z-score is known, a standard normal distribution table or calculator can be used to find the probability. This result indicates the likelihood of a score occurring within a specific range on the bell curve.
Conclusion
Understanding grading curves and normal distribution concepts can help educators make more informed and equitable assessment decisions. Whether using a grade curve, a square root adjustment, or probability calculations, these statistical methods provide valuable tools for interpreting student performance. By applying these techniques appropriately, teachers can improve grading fairness, maintain academic standards, and gain deeper insights into classroom achievement.
Disclaimer

The results and grades provided by TatolGrader.com are for informational and reference purposes only and should not be considered as official academic evaluations. We do not guarantee the accuracy, completeness, or reliability of any grading results generated on this platform. TatolGrader.com is not affiliated with any educational institution and holds no responsibility for decisions made based on the information provided. By using this site, you agree that the platform bears no liability for any errors, omissions, or outcomes resulting from your use of this service.